{ "@context": "https://schema.org", "@type": "LegalService", "name": "Begam Marks & Traulsen, P.A.", "image": "https://arizonapersonalinjuryattorneys.net/wp-content/uploads/2020/06/bmt-law-logo.png", "url": "https://arizonapersonalinjuryattorneys.net/", "telephone": "(602) 254-6071", "priceRange": "Free Consultation", "address": { "@type": "PostalAddress", "streetAddress": "11201 N Tatum Blvd. #110", "addressLocality": "Phoenix", "addressRegion": "AZ", "postalCode": "85028", "addressCountry": "US" }, "geo": { "@type": "GeoCoordinates", "latitude": 33.587514, "longitude": -111.975842 }, "openingHoursSpecification": { "@type": "OpeningHoursSpecification", "dayOfWeek": [ "Monday", "Tuesday", "Wednesday", "Thursday", "Friday" ], "opens": "07:30", "closes": "16:30" } } window.dataLayer = window.dataLayer || []; function gtag(){dataLayer.push(arguments);} gtag('js', new Date()); gtag('config', 'UA-31800636-1');

2015-2017

An analysis of
fatal truck accident statistics

Over the past several years, the number of large trucks on our roadways has continued to increase. Along with the growing number of miles driven by truckers has come an overall increase in crash rates and truck-related crash deaths. Our Phoenix personal injury lawyers have collected and analyzed three years worth of fatal crash data to make this the most comprehensive collection of truck accident statistics and facts on the Internet.

overpass
overpass
geo-detail

From 2015-2017, large trucks were involved in nearly 11,000 fatal crashes on U.S. roadways-killing 12,230 people.

geo-detail

Each year, both fatal crashes and total fatalities increased – with an 11.4 percent increase in fatal truck crashes and a 10.5 percent increase in fatalities in 2017 over those in 2015.

2015

3,468

Fatal Crashes

3,914

Fatalities

2016

3,645

Fatal Crashes

4,080

Fatalities

2017

3,865

Fatal Crashes

4,326

Fatalities

road

Accidents in the commercial trucking industry

geo-detail

In the United States, nearly 70% of all freight is transported by truck, accounting for $671 billion worth of manufactured and retail goods being transported by truck every year. According to the National Highway Traffic Safety Administration (NHTSA), in 2015 there were 11,203,184 large trucks registered, while in 2016 that number increased to 11,498,561 (NHTSA, 2019). Clearly, we are highly dependent upon large trucks.

Large trucks are considered medium or heavy trucks (excluding buses and motor homes) with a gross vehicle weight rating (GVWR) greater than 10,000 pounds; they may be commercial or non-commercial vehicles. The majority (79%) of the large trucks involved in fatal traffic crashes in 2017 were heavy large trucks (GVWR > 26,000 lbs.), while that number was 80% in 2016 and 86% in 2015.

Large trucks accounted for 9% of the vehicles involved in fatal accidents in 2017. Of the 4,657 large trucks involved in those crashes, 69% were combination trucks (tractor-trailer, doubles, straight truck with trailer, etc.) (Vehicles, 2017).

Additionally, research shows:
  • According to NHTSA statistics, fatal incidents involving tractor trailers rose 5.8% in 2017 from 2016, and accidents involving straight trucks (those not part of a tractor-trailer) were up by 18.7%.
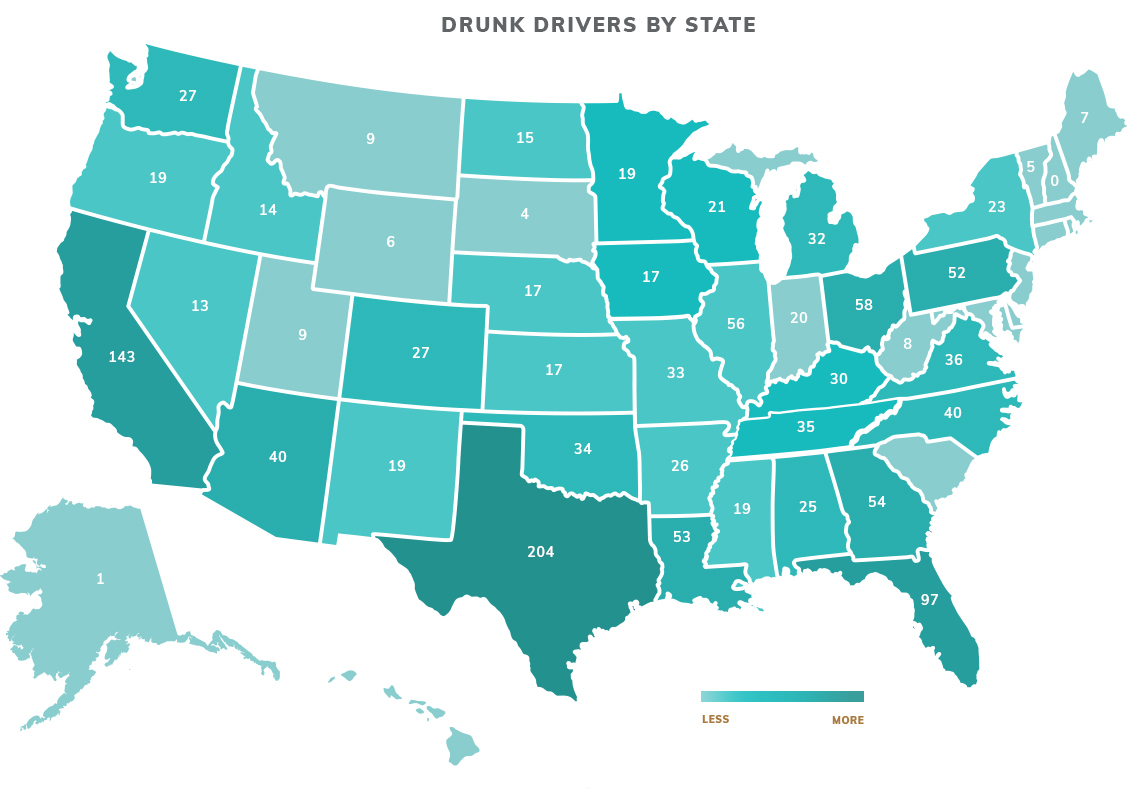
  • Between 2015 and 2017, the number of occupants in passenger vehicles killed ranged from 2 in the District of Columbia to 1,358 in Texas.
  • Also, between 2015 and 2017, 33 states each had more than 100 occupants of other vehicles killed in large-truck crashes, 21 had more than 200, and 10 had more than 300 fatalities as a result of a large truck crash accident.
  • In 2017, the largest percentage of drinking drivers involved in fatal crashes and who had blood alcohol concentrations (BACs) of .08 g/dL or higher were 1) motorcycle drivers (27%), 2) passenger car drivers (21%), 3) light truck drivers (20%), and then 4) heavy truck drivers (3%). These numbers were similar in the previous two years (NHTSA, 2019).
  • Large-truck drivers did, however, have a higher percentage (20.7%) of previously recorded crashes compared to drivers of other vehicle types (motorcycles, 20.3%; passenger cars, 19.1%; light trucks, 17.0%).

When do fatal truck crashes occur?

As you might expect, most fatal trucking accidents occur on weekdays, with the fewest occurring on Sundays by far (701 fatal crashes), followed by Saturday (1,026).

At the same time, fatal crashes do not coincide with typical rush hours. In fact, the most crashes occur during 11 am and 4 pm, peaking at the 1 pm hour with 676 fatal crashes.

Where do fatal truck crashes occur?

The majority of fatal trucking crashes occur in rural areas on interstate highways and primary arterial roads. The 15 roads with the most fatal trucking crashes include:

At the state level, the highest number of fatal truck collisions
occurred in Texas - with 1,358 crashes – followed by:

1,358
Texas
846
California
693
Florida
514
Georgia
405
Pennsylvania

At the county level, Southern California counties dominate the list, with three of the top five and four of the top ten counties.

  • 123 fatal crashes

    Los Angeles County, CA

  • 87 fatal crashes

    San Bernardino County, CA

  • 81 fatal crashes

    Harris County, TX

  • 75 fatal crashes

    Maricopa County, AZ

  • 71 fatal crashes

    Kern County, CA

  • 66 fatal crashes

    Dallas County, TX

  • 59 fatal crashes

    Cook County, IL

  • 8 fatal crashes

    Riverside County, CA5

  • 44 fatal crashes

    Tarrant County, TX

  • 43 fatal crashes

    Clark County, NV

Perhaps unsurprisingly, when looking at the city level, fatal truck crashes accumulated in large cities, with the top 10 being:

  • 69 fatal truck crashes

    New York City, NY

  • 48 fatal truck crashes

    Houston, TX

  • 42 fatal truck crashes

    Los Angeles, CA

  • 42 fatal truck crashes

    Dallas, TX

  • 35 fatal truck crashes

    Jacksonville, FL

  • 34 fatal truck crashes

    Memphis, TN

  • 32 fatal truck crashes

    San Antonio, TX

  • 30 fatal truck crashes

    Phoenix, AZ

  • 30 fatal truck crashes

    Oklahoma City, OK

  • 27 fatal truck crashes

    Chicago. IL

Passenger vehicle drivers killed in truck accidents

geo-detail

The vast majority of deaths involving large truck crashes are passenger vehicle occupants. Passenger vehicles are especially vulnerable in crashes with large trucks simply because of their smaller size; trucks can weigh 20-30 times as much as a passenger vehicle and can be taller with greater ground clearance. This can result in underride crashes, where the car slides under the truck itself, often resulting in devastating injuries for the car occupants.

  • Since 1974, 208,809 people have been killed in large truck accidents – 146,123 of which were occupants of passenger vehicles.
  • In that same time period, passenger vehicle occupants and non-occupants (pedestrians and bicyclists) have made up over 82 percent of all deaths in large truck crashes.
  • Large truck occupants have made up just 16 percent of trucking fatalities
  • In two-vehicle crashes involving a passenger vehicle and a large truck in 2017, nearly all – 97% - of those killed were occupants of the passenger vehicles.
  • Most often, collisions were front to rear (the truck was rear-ended by the passenger vehicle). In fact, trucks were struck from behind 4 times more often in 2015 and 3 times more often than the other vehicle involved in the crash in 2016 and 2017 (NHTSA, 2019).

Large Trucks and Underrides

From 2015-2017, there were 910 fatal crashes involving an underride - where a passenger vehicle slides under the back or sides of a large truck or trailer. Pennsylvania led the nation in fatal underride accidents - with 118 - followed by California - with 89 - and Texas with 69.

  • The University of Michigan Transportation Research Institute (2013) studied 8,309 fatal car/truck crashes and found that 81% of time drivers of passenger vehicles were assigned fault (vs. 27% for truck drivers).
  • The National Highway Traffic Safety Administration (NHTSA, 2003) studied 10,092 fatal accidents and found that cars were responsible 91% of the time in head on crashes, 91% of the time in opposite direction sideswipes, 77% of the time in same direction sideswipes, and 71% of the time in rear end crashes.
  • The Federal Motor Carrier Safety Administration (FMCSA) study looked at 6,131 fatal car/truck crasher between 2007 and 2009 and found that cars were assigned fault in 85% of crashes the first two years and 81% in 2009. When a large, heavy truck needs to stop quickly, braking is going to be a problem every time. Braking capability will be a factor in many passenger vehicle/heavy truck crashes depending upon the truck’s load; loaded heavy trucks can take 20% to 40% farther than a car to come to a stop, and even more if the surface of the road is wet or the brakes on the rig are poorly maintained.

No matter who was at fault in the accident, the fact is that there was a steady incline in the number of deaths as a result of truck/passenger car crashes each year between 2015 and 2017. It is also important to note that the assigned fault is not always correct and a thorough investigation of individual accidents may reveal evidence not available at the outset.

Some other facts you should know:

  • At least 39% of large truck occupants killed in crashes were not wearing a seatbelt
  • More fatal crashes occurred in rural areas than in urban
  • Fatal crashes are more likely to occur away from intersections
  • Only a small percentage (5%) of fatal crashes with large trucks occurred in work zones

Truckers killed in truck/
passenger vehicle accidents

geo-detail

The vast majority of deaths involving large truck crashes are passenger vehicle occupants. Passenger vehicles are especially vulnerable in crashes with large trucks simply because of their smaller size; trucks can weigh 20-30 times as much as a passenger vehicle and can be taller with greater ground clearance. This can result in underride crashes, where the car slides under the truck itself, often resulting in devastating injuries for the car occupants.

  • By 2017, traffic fatalities involving large trucks rose 9% year after year to the highest level in 29 years.
  • Heavy-duty truck fatalities rose 3% between 2016 and 2017.
  • Speed was a factor in 17% of truck crashes with at least one large truck occupant fatality (FARS, 2017).
  • For trucks in the largest weight segment, Class 8, deaths climbed by 221 in 2017 from the previous year to 3,844 - a 4% increase for trucks weighing more than 33,000 pounds.
  • Many drivers are still driving unrested and under the influence. According to the National Transportation Institute, approximately 1 in 7 applicants for trucking jobs cannot pass a drug test.
  • Fatigue and lack of sleep are cited as danger signs in multiple studies of truck driver safety.
  • Trucking as a profession had 26.8 deaths per 10,000 workers, compared with 3.5 deaths per 10,000 for all professions.
  • A record number of truckers (840) died on the job in 2017 (Bureau of Labor Statistics, 2018).
  • The highest number of occupants of large trucks killed in a single state was 129 in Texas. The state with the fewest number of fatalities was 2 in DC.
  • Drowsy and distracted driving is as much a rising problem among truck drivers as for everyone else on the road.
  • Some speculate that more trucking deaths may be related to drivers “racing the clock” against regulations that limit driving to 11 hours in a 14-hour period with a 30-minute break at eight hours.

Some other important facts you should know

  • More than 21% of all large-truck drivers involved in fatal crashes had at least one prior speeding conviction, nearly the same number as that of passenger car drivers involved in fatal crashes.
  • Drivers of large trucks in fatal crashes were less likely to have previous license suspensions or revocations than were passenger car drivers (9.2% and 16.6%, respectively).
  • One of the most common causes sited (nearly 4%) for crashes in our dataset was loose or falling objects from trucks into traffic or onto passenger vehicles, followed by previous crash scenes nearby or stalled/disabled vehicles.
  • Of the truck drivers involved in fatal crashes during 2015 – 2017, 2,279 had been involved in at least one other accident within the last five years, 137 drivers had been involved in 3 or more crashes.

Which truck manufacturers are involved in the most fatal crashes?

While there are only a handful of major large truck manufacturers, Freightliner is the most often involved in fatal crashes

3560

freightliner

908

peterbilt

828

international harvest

765

kenworth

569

volvo

525

mack

459

ford

154

dodge

132

chevrolet

125

gmc

Most common truck driver behaviors related to fatal accidents

When noted in the crash report, a truck driver’s failure to yield the right of way was the most common factor related to the crash. Here are the rest of the top 10:

  • 554 crashes

    Failure to yield right of way

  • 446 crashes

    Careless Driving

  • 369 crashes

    Improper lane usage

  • 283 crashes

    Failure to obey traffic sings and signals

  • 251 crashes

    Following improperly

  • 199 crashes

    Over Correcting

  • 139 crashes

    Stopping in Roadway

  • 125 crashes

    Erratic or reckless vehicle operation

  • 118 crashes

    Improper lane change

  • 101 crashes

    Making an improper turn

Pedestrian deaths due to truck accidents

geo-detail

While a pedestrian/motor vehicle accident is serious in any event, the danger increases immensely when that vehicle is a truck. For our purposes here, pedestrians are non-vehicle occupants and could include those who are walking, skateboarding, cycling, etc.

A semi-truck and a pedestrian are a deadly combination. Heavy- and tractor-trailer truck drivers have the highest numbers of pedestrian deaths of any occupation; that is principally because it is so difficult for drivers to see pedestrians from a large truck.

Other reasons could include driver distraction, drowsy driving, and of course, speeding – it takes much more time and distance to stop a large truck than it does a lighter passenger vehicle. That means that weather, lighting, and poorly maintained equipment can all contribute to pedestrian crash accidents.

  • Between 2015 and 2017 there were 1,348 pedestrian deaths and thousands more injured due to large truck accidents.
  • Also during that same time period:
    • 411 pedestrians were killed in rural areas while 800 were killed in urban areas.
    • 207 pedestrians were killed in 4-way intersections, 82 to T-intersections, 4 at Y-intersections, and 6 at other intersection types.
    • 557 pedestrians were killed in work zones
  • Passenger cars and light trucks (including SUVs, pickups, and vans) had higher percentages of frontal impacts than did other vehicles, including large trucks or buses.
  • Large trucks, however, had the highest percentage of right-side impacts and rear impacts.

The financial consequences of truck crashes

geo-detail

The financial costs of a truck accident can be astronomical, especially when a death is involved. Big rig trucks in particular can cause catastrophic injuries and damage to property simply because of their massive size and weight. A serious collision with one of these huge trucks can easily result in death or irrecoverable loss on the part of the other driver or pedestrian, not to mention the drivers themselves.

While studies show that most truck drivers tend to exercise more caution than the rest of us when on the road, large truck crashes still account for thousands of fatalities and many, many more injuries every year. Because so many factors can contribute to unforeseen trucking accidents – road hazards, bad weather, careless or distracted drivers, and too many more to mention here – the consequences can be devastating.

  • Due to the high fatality incidence in truck crashes, related costs can be in the millions.
  • The average cost of a fatal crash can be well over $3 million.
  • The average cost of a large truck crash that does not involve a death is approximately $62,000.
  • Traffic accidents are thought to cost the U.S. $871 billion every year.
  • Truckers are under tremendous pressure due to “on time delivery” promises in so many industries. Such a work environment “creates havoc for the fleet manager, the logistics manager, and ultimately the driver.”
  • Increasing truck size means drivers are traveling more miles and are on the roads longer. This drives costs up all around.
  • While trucks are becoming “smarter” like many cars on the road, this requires more and costlier training of drivers. One question is whether adding all this new technology to these vehicles is actually helping to increase safety on the road or, instead, adding to driver distraction.

Some safety awareness tips

  • Start by sharing the road. There are many government agencies promoting large truck safety, but the truth is that truck drivers and passenger vehicle drivers need to be considerate of each other, follow safety rules closely, and learn to better share the road.
  • Never dart unexpectedly in front of a truck – remember the driver will need more time to stop that a smaller vehicle will require. Instead:
    • be predictable
    • signal your intentions
    • give these larger vehicles time to respond
  • Remember that large trucks have more blind spots than smaller cars. Stay well behind the driver so he or she can see you, and stay especially wide on the right whenever possible.
  • Use caution when passing. Again, keep that blind spot in mind, so pass when the driver can see you. Also, take into account that a truck’s speed will naturally increase on down hills and decrease when climbing up.
  • Give large trucks plenty of space. Especially when winds are high (strong winds can cause truck rollovers) or when road conditions could lead to tire blowouts an(the debris could hit your car in the windshield and cause an accident).
  • Lower you bright headlights. Bright headlights are blinding for everyone but can be dangerous when they shine on the large mirrors of a truck. Only use your bright lights when absolutely necessary and they don’t endanger other drivers.
  • Use a seat belt whenever traveling. Research shows that while only about 11% or 12% of all persons involved in fatal accidents were not using their seat belt, they accounted for about 40% of all fatalities.

While the NHTSA cannot provide any concrete reasons why the trend upward has continued as it has when it comes to fatalities on the road, the fact that there simply are more vehicles traveling more miles than ever before. Far too many of us are distracted drivers, people who still do not use seatbelts, pedestrians who do not pay attention to our surroundings, and who don’t always stay alert to the host of other contributing factors around us every day.

Resources:

https://www.fmcsa.dot.gov/sites/fmcsa.dot.gov/files/docs/safety/data-and-statistics/461861/ltcbf-2017-final-5-6-2019.pdf
https://www.trucks.com/2018/10/31/heavy-duty-trucking-deaths-racing-clock/
https://www.fmcsa.dot.gov/safety/data-and-statistics/large-truck-and-bus-crash-facts-2017
https://www.fmcsa.dot.gov/safety/data-and-statistics/large-truck-and-bus-crash-facts
https://www.fmcsa.dot.gov/sites/fmcsa.dot.gov/files/docs/safety/data-and-statistics/413361/fmcsa-pocket-guide-2018-final-508-compliant-1.pdf
https://www.fmcsa.dot.gov/safety/analysis-research-technology
https://crashstats.nhtsa.dot.gov/Api/Public/ViewPublication/812602
https://crashstats.nhtsa.dot.gov/#/DocumentTypeList/23
https://cdan.nhtsa.gov/tsftables/tsfar.htm#CDC Vital Signs [2015]. Trucker Safety.
https://crashstats.nhtsa.dot.gov/Api/Public/ViewPublication/812497.pdf
https://crashstats.nhtsa.dot.gov/Api/Public/ViewPublication/812373
https://crashstats.nhtsa.dot.gov/#/PublicationList/85
https://crashstats.nhtsa.dot.gov/Api/Public/ViewPublication/812663
https://www.trucks.com/2018/12/19/truckers-dying-record-numbers-job/
https://www.kansascity.com/news/politics-government/article217849815.html

Note:

In our current analysis, we utilized data from the Fatality Analysis Reporting System (FARS, 2019) database and included the following truck categories: straight trucks (low, medium, high, and unknown GVW) and two-unit, multi-unit, truck-tractor, and unknown type trucks. For that reason, our numbers may differ slightly from those above.